Sunday, September 20, 2009

Why borrow? Rational Expectations Redux and why nominal prices matter

Unrealized capital gains were a particularly important factor in the increase in net worth over the 2004–07 period. The share of total assets attributable to unrealized capital gains from real estate, businesses, stocks, or mutual funds rose 5.1 percentage points, to 35.8 percent in 2007. Although the level of debt owed by families rose noticeably, debt as a percentage of assets was little changed. The largest percentage change in debt was in borrowing for residential real estate other than a primary residence.

With median and mean debt advancing faster than income, payments relative to income might be expected to increase substantially. In fact, total payments relative to total income barely increased, and the median of payments relative to income rose at a slower pace than it did between 2001 and 2004. Nonetheless, the share of families with high payments relative to their incomes increased notably.
From the 2007 Survey of Consumer Finances. Emphasis added.

Yet more evidence, together with the Permanent Income Hypothesis, that people look at their earnings power over time as an asset, just as any other asset, and their willingness to incur debt is due to how they price that earning-asset (together with their financial assets). A house is a 30 year commitment -- so you need to estimate 30 years of wages, discounted by both inflation and the risk of volatility in those wages. Same thing for other durables, and this percolates into day-to-day spending as well. "Flexible wages" are deeply destabilizing, as assets with volatile earnings are priced lower than assets with reliable earnings. Flexible wages would cause a further decrease in demand in excess of the actual change in wages.

Wednesday, September 16, 2009

Inequality and Debt growth

The following chart, taken from census data, shows the growth of income inequality since 1967:


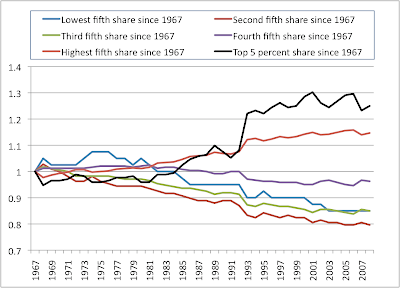
The chart shows the share of national income for each cohort: bottom fifth, second fifth, third fifth, fourth fifth, top fifth and top 5%. You would expect the bottom fifth to collect a smaller share of income than the top fifth -- these ratios have been normalized so that 1967 =1. I.e. We assume 1967 is a "sustainable" level of inequality and track the increase that occurred since then.

Focusing on the third fifth, or "middle America", we can see the income gap from the decline in it's share of income from 1967 to 2008:


The next chart shows the growth of household debt/GDP since 1967 (i.e. we set the 1967 level to zero, and look at the increase that has occurred since then.) At the same time, we plot the running total of the income gap for the third fifth:


The growth in debt was a re-cycling mechanism, allowing the middle class to continue consuming (and hence maintain GDP growth) all while incomes fell. In other words, wages shifted from the middle incomes to top management/asset holders, while at the same time the purchasing power of the middle incomes was maintained by debt-financing. The increase in household debt funded the increased gains for the top incomes.

The total amount spent on wages did not change very much, but the distribution changed, effectively the top 1% earned much more, the top decile net of the top 1% stayed the same, and everyone else's wages collapsed.

In such an environment, if workers are paid less, they wont be able to purchase goods, demand will decrease, and therefore prices will fall to adjust, meaning lower profits for the owners of capital, and the income balance will be restored in real terms.

Debt-financing can be used as a mechanism to prevent this adjustment. As long as the debt is rolled over -- as long as consumers are willing to take on more debt -- inequality can grow and prices/profits will not adjust to reflect the lowered wages of average employees.

In this case, the asset base will swell, interest rates will fall, the debt stock will swell, and consumption will remain constant even as wages fall. That is, until a debt crisis occurs.

A similar dynamic can be seen with the current account. The Chinese government confiscates dollars from exporters, prints up RMB and "buys" those dollars at prescribed rates. The end result is that the people who produce goods suffer inflation as the goods are loaded on ships to disappear. As a result, the real purchasing power and consumption of the Chinese workers is suppresed, while U.S. workers are put under wage discipline. There is transfer of technology which helps China, but you can have technology transfer without suppressing wages. Again, debt-financing is used to bypass the market adjustment, this time of currencies as well as real wage rates in China.

This is the key macro-economic and political problem of our era -- debt-financing is being used to suppress wages, preventing necessary price adjustments from bursting the income concentrations, and this dynamic is fundamentally de-stabilizing.

But until we understand the root of the problem, we wont be able to address it. The problem isn't "Debt" in some abstract sense, and it certainly isn't "too much borrowing" in and of itself, since the borrowing was only an attempt to keep wages at their 1967 share of GDP. In other words, that middle quintile only borrowed enough to try buy their own domestic output. The problem is not paying workers enough money to maintain demand for the goods they produce. This is why we are suffering from chronic demand shortages, asset bubbles, abnormally low interest rates, record inequality, and crushing private debt.

Tuesday, September 15, 2009

For every invested dollar...


... almost 80 cents goes to pay the salaries, bonuses, and other benefits of employees in the Financial Services and Insurance Industries.

"Domestic Investment" is defined as gross investment exenditures by both the government and private sectors net of depreciation. "Finance and Insurance" compensation consists of BEA FIRE compensation data net of real estate sector compensation.

Monday, September 14, 2009

Whose government is it?

You can tell the priorities of government by looking at what it is trying to optimize.
China is printing RMB like no tomorrow, so that they can sterilize dollar inflows and keep exporting. They are interested in developing domestic capital: skills, a trained workforce, technology transfers, research and development, viability of the business sphere and full employment.

Reading Keynes, the emphasis was always on maintaining full employment. Then the emphasis shifted to total output growth. And since then the emphasis has shifted to protecting bondholders and keeping inflation and interest rates low.

We are protecting and bailing out bondholders, not investing in our capital base or fighting to build the tangible things that create wealth for the future: better infrastructure, education, research, stable business profits and high wages.

Any government that is more concerned with inflation and interest rates than with employment and business development has been taken over by the illusion that financial wealth is equivalent to real wealth.

Sunday, September 13, 2009

The Price/Earnings Ceiling

From the valuation approach described previously, we can look at the earnings yield of a broad index such as the SP 500 and invert the growth formula:
earnings yield = dividend yield + growth rate
to obtain:
P/E = 1/(dividend yield + growth rate)
To put an upper bound on the P/E ratio, we want a lower bound on the yield + growth rate. Generally speaking, the total returns on capital (for equities, that would be growth rate and dividends) have been the GDP growth rate over the period. That is one of Kaldor's "stylized facts", which actually says that returns to capital as a fraction of GDP are the same over time, and that therefore the growth rate will be the same. Now, that doesn't need to be in equity, it could be in other forms of capital, but over time, it's hard for the equity returns to outgrow the total returns.

If you don't like the Kaldor argument, then notice that GDP = GNI, so that if national incomes are growing at g, people will be willing to accept effective bond rates of a little below g, so that the premium for equity should be a little higher than that. So that gives g as the expected returns from capital.

So that gives a long run upper bound (actually approximate equality) for the P/E multiple for the equity market as a whole. Obviously the variance is large :) Going forward, output growth may continue to slow.

Suppose you think a GDP growth rate of only 4% (nominal) is warranted over the next 20 years. In that case, the average P/E multiple would be at most 25, but there is a good chance that the equity markets wont like such a low yield, and money will shift to other forms of capital.

This surprises people who associate "high multiples" with growth stocks, but that is only to the degree that their multiple is higher than that of the index. The economy as a whole grows with GDP, as does the return to equity capital as a whole. Some specific returns may be more highly valued, but if the entire index is more highly or lowly valued than the yield available for the economy, then you are looking at a bubble or arbitrage opportunity. Historically 10 years has been long enough for this to unwind, and 20 years certainly has.

The larger the deviation, the more difficult it is to maintain earning growth as the company grows. For the SP 500 as a whole, if it is a constant share of capital, then the multiple will increase in absolute terms as yields fall.

It is usually better to buy when earnings are collapsing, but in this case you look at "smoothed" 10 year earning multiples (i.e. the current price divided by the average real earnings over the last 10 years). This would allow you to not be fooled into thinking that a high multiple is expensive, when in reality the denominator is abnormally low. Alternately, smoothing will not let you think that anything goes -- for example the July 2009 multiple was 117 -- and the market kept climbing.

FYI, in July '09, the smoothed P/E multiple was about 18. Not cheap by any means, and certainly not sustainable, unless you are assuming something along the lines of a dividend yield of 2% and nominal earning growth rates of 3.5% going forward. In that case, it might not have been a bad idea to buy. Just be aware that a high multiple is only justified on a long term basis only if we experience a secular growth collapse that also would also result in long term bond yields falling to well below 3.5% as well. Such an environment might not fare well for equities.

Saturday, September 12, 2009

Negative Re-Investment Rates


When the cost of equity capital is low, then the re-investment rate is high. This is dangerous for firms because the market is fickle, and periods of complacency quickly turn into panics, at which point the capital is re-priced, and now higher returns are demanded. Companies respond to this by trying to defend their dividends and thus end up liquidating a portion of their capital stock in the form of layoffs, shutdowns, and other asset sales.

You can see a historic negative re-investment rate in this graph, corresponding to capital liquidation for the market as a whole.

Note that this is different from lowering the re-investment rate as you would expect in a regular recession. As long as the re-investment rate is positive, then productive capacity is still being increased, but at a lower rate. I.e., the growth of productive capacity is "slowing down" as opposed to shrinking.

Layoffs are always occuring as is hiring, but when the market as a whole has a negative re-investment rate, then productive capacity as a whole is decreasing. You can think of the difference as that between laying off a few workers versus closing a factory. It is harder for employment in the latter case to recover because it requires a greater investment commitment on the part of management as they emerge from the recession. But this is exactly when management is still skittish. This is not to say that employment can't or wont recover -- but the hurdle will be higher.

Moreover, the graph suggests that the current market downturn is fundamentally different from the crashes and recessions in earlier periods. You have to go back to Great Depression, the 1921 recession, or the Long Depression (1893-1898) to find such periods of negative re-investment, and all of those periods were dwarfed by the negative re-investment that we see today. Note that all three of the historical precedents were deflationary recessions.

Valuing Equities without Discounting


In the diagram above, each time a firm generates profits (earnings), a portion are paid out as a dividend, and the remainder are re-invested, adding to the firm's capital stock. Assuming that the firm is on a stable growth trajectory, then the various multiples (price to earnings or price to dividend) should be constant over time, while the earnings, dividend, and market cap should grow with some real growth rate, g. If this were not the case, these multiples would go to zero or to infinity over time.

By "real growth rate", I mean the logarithmic derivative (i.e. (1/x)dx/dt = g). Now let r be the re-investment ratio:

r*earnings = retained earings = earnings - dividend

In particular, if r = 1, then all earnings are re-invested, and if r is negative, then the firm is selling off capital, since it cannot meet the owners' required rate of return.

Then the growth rate of capital (dC/dt) is just rE -- the amount re-invested. Therefore the "real growth rate" is rE/C, so that we have

g = rE/C = r*(E/C) = r*(earnings yield)

Which we can re-arrange to read:

dividend yield = ((1-r)/r)*g= (1/r-1)*g
earnings yield = g/r
earnings yield – dividend_yield = g
earnings yield = dividend yield + g ("dividend capitalization model")
  • g = growth rate of earnings, dividends, market-cap
  • r = re-investment ratio

This allows us to value equities without discounting infinite sums -- by defining steady-state ratios. The assumption is only one of stability (which the discounted sums approach also requires). In order to value a company, you need to estimate the earnings growth rate as well as the dividend yield (or the re-investment ratio). This gives the standard "dividend discount" valuation approach, although the method here is a bit more general, in that no dividends need to be paid -- full re-investment is also allowed.

Now, in the real world, the market doesn't know how much to value capital -- that is a difficult problem and so the market value oscillates around the "true" value, as investors constantly adjust their expectations based on optimism and pessimism, excessively marking down the value of capital during busts, and over-valuing capital during booms. To see these mood swings, consider the following:


This chart graphs the stable growth path, g, obtained by taking the 10 year average earnings-yield and the present dividend yield. It then graphs the 10-year trailing average of the observed earnings growth.

You can see that there are turning points, in which the actual earnings growth (blue) wildly overshoot and undershoot. These are equivalent to "earnings booms" and "earnings busts", in which the earnings grow much faster or slower than the required growth rate as determined from a 10 year backwards-looking window. These correspond to secular booms and busts in corporate profits, and are influenced not just by changes in output, but by debt-fueled demand, tax law changes, access to new markets, etc.

In general, expectations formation is backwards looking but there are real turning points -- changes in mood about the future (such as the Great Depression or the post-war boom) that a purely backward looking metric will not detect. Also note that the booms and busts are secular -- they last much longer than simple recessions, so that large multiples seem normal, until the next collapse and re-pricing, or until the next boom occurs.
The header photo is a Creative Commons image (but was published in 1906, so it should be in the public domain).

About

The Old Barkeep hails from Phoenix and lives in San Francisco, where he can keep an eye on things. This blog is his public notepad.

Subscribe Now: Feed Icon